

The flow of data
Our main niche is to design tags which relay data ashore. Whilst there is thus no need to recover the tag to download data, a recovered tag can also provide a complete data set. To relay data we use either the Argos satellite system or the GSM mobile (cell) phone system. We are also currently exploring the use of the Iridium satellite system.
Tags which use the ARGOS network.
At various times throughout the day, a tag will check it is not currently underwater and then attempt to transmit messages to the network of ARGOS satellites in orbit overhead. SMRU servers regularly poll the ARGOS system for messages that have been picked up along with the associated locations.Positions and estimates of location quality have already been calculated by ARGOS and can normally be made available within a few hours, although ARGOS may occasionally re-process data and update location estimates retrospectively.
The incoming messages containing your data are decoded using the appropriate parameters for each tag. These will have been stored in the tag's buffer and sent according to the pre-programmed transmission strategy. Any given message can, therefore, contain quite recent or older buffered data.
The decoded data values are then stored in appropriate tables within a database.
Tags which use mobile phone networks
Although these can only relay data when in range of a GSM cell tower, this can be by SMS text message, direct data connection to our server or via FTP over GPRS.GPS locations are resolved from pseudo-ranges calculated onboard the tag from snapshots and then relayed back to our server for further processing. If many such stored snapshots are successfully transferred at one time it can take several hours to process them all.
SMRU Instrumentation's Data portal
The telemetry group at SMRU run a web-based data portal through which tag data can be viewed and downloaded. This provides:- tables summarising the latest data received for each tag
- maps showing the tracks and most recent locations of the animals
- strip charts showing time series data received from each tag.
- CTD salinity and temperature profiles
- a downloadable database containing the most current dataset for a given deployment of tags, providing the opportunity for further analysis (e.g. using R or MamVisAD).
- documentation explaining strip charts etc.
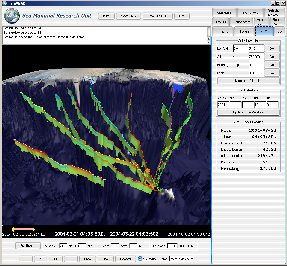
MamVisAD
MamVisAD
is a powerful multi-platform 3D visualisation package developed at SMRU specifically for the display and investigation of data from our marine mammal telemetry devices.
Features
- Interactive globe style 3D visualization of the ocean.
- Display of tracks alongside bathymetry, SSTs and sea-ice fields.
- Linked time series displays and spreadsheets.
- Built upon open source software; Jython, VisAD & Java.
Benefits
- Developed specifically to work with telemetry data from SMRU tags.
- Easy exploration of tracks, dives and CTD casts through time.
- Images and animations for presentations.